
Lucidchart
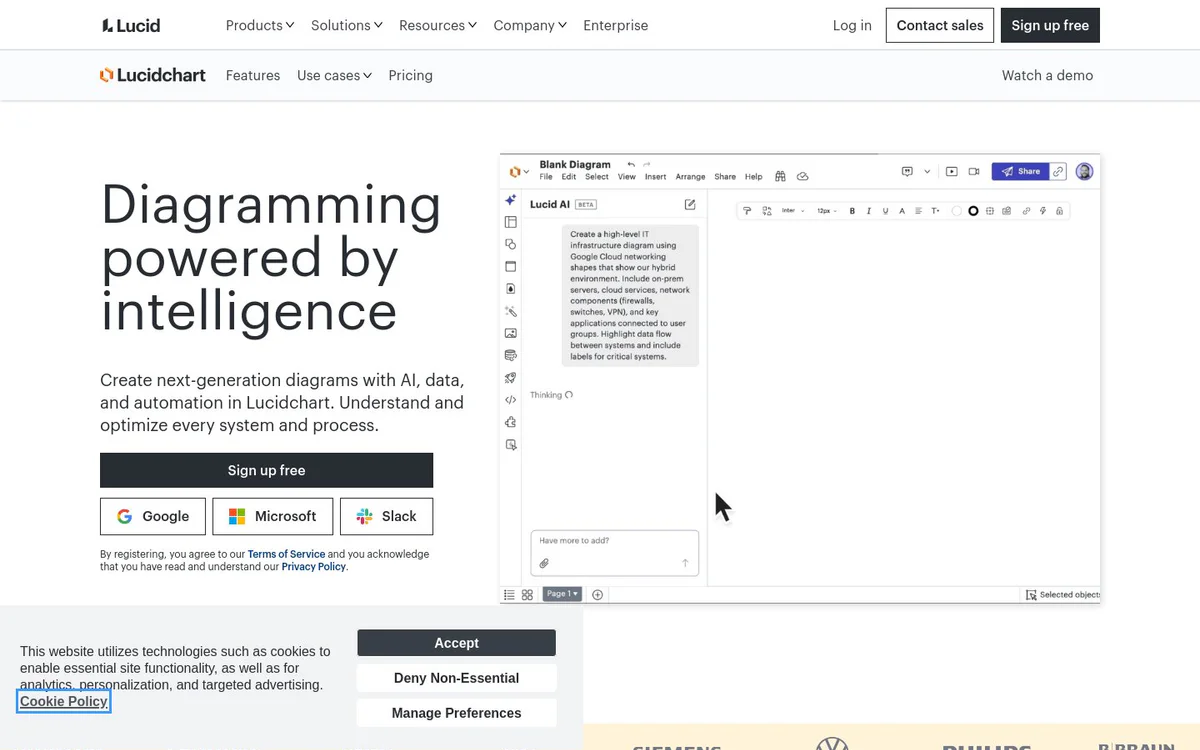
FreemiumIntelligent diagramming powered by AI, data, and automation
工具信息
什么是 Lucidchart?
Lucidchart is an intelligent diagramming platform that helps teams create AI-generated diagrams, process maps, org charts, technical diagrams, and system architectures. It combines data linking, automation, and real-time collaboration so users can understand and optimize systems and processes with next-generation visual documentation.
核心功能
Lucid AI
Type text prompts to create AI-generated content automatically on the Lucidchart canvas, enhance prompts, generate diagrams, and summarize content.
Data linking
Link diagrams to data sources for dynamic, data-driven visualizations and improved visibility.
Conditional formatting
Apply rules-based formatting to diagrams for clearer insights and technical documentation.
UML markup
Create UML diagrams using markup for technical and systems documentation.
Layers
Use layers to organize complex technical diagrams and improve clarity and efficiency.
Real-time collaboration
Collaborate on diagrams in real time or asynchronously to create shared visual documentation and align teams.
Diagram as code
Generate and maintain diagrams using code-based approaches for process mapping and technical work.
Data imports
Import data to automatically build dynamic org charts and other visualizations by department or team.
Templates
Start from ready-made templates for process flows, org charts, roadmaps, BPMN, AWS diagrams, ERDs, UML, C4 models, and more.
Lucid Custom GPT
Custom GPT capability for enhanced AI-assisted diagramming workflows.
使用场景
- #1
Process maps and flowcharts
Establish a single source of truth to map out and optimize processes using diagram as code, quick diagramming, and real-time collaboration.
- #2
AI-generated diagrams
Save time by using AI to generate diagrams and summaries from prompts and text.
- #3
Org and team planning
Build dynamic org charts to visualize people and workloads by department or team with data imports, data linking, and group view.
- #4
Technical diagrams
Improve documentation clarity and efficiency with ERD markup, conditional formatting, and layers.
- #5
Systems and architecture
Visualize infrastructure as a central communication hub using AI prompt flow, linking and embedding, and cloud shape libraries.
- #6
Process documentation
Document and standardize processes for digital transformation, cloud migration, and operations.
- #7
Visualizing teams and infrastructure
Create shared understanding of team structures, workloads, and technical infrastructure.
定价方案
Sign up free is available; contact sales and pricing page are offered for additional or enterprise options.
替代工具







常见问题
What is Lucidchart?
What can Lucid AI do in Lucidchart?
Does Lucidchart support real-time collaboration?
What kinds of diagrams can I create with Lucidchart?
Is Lucidchart free to use?
Which platforms and integrations does Lucidchart support?
Lucidchart 联系方式与社交媒体
- 公司Lucid Software
- 支持
- 网站:
- Twitter
- Facebook
- Instagram
- YouTube
- LinkedIn
- TikTok