
Bricks
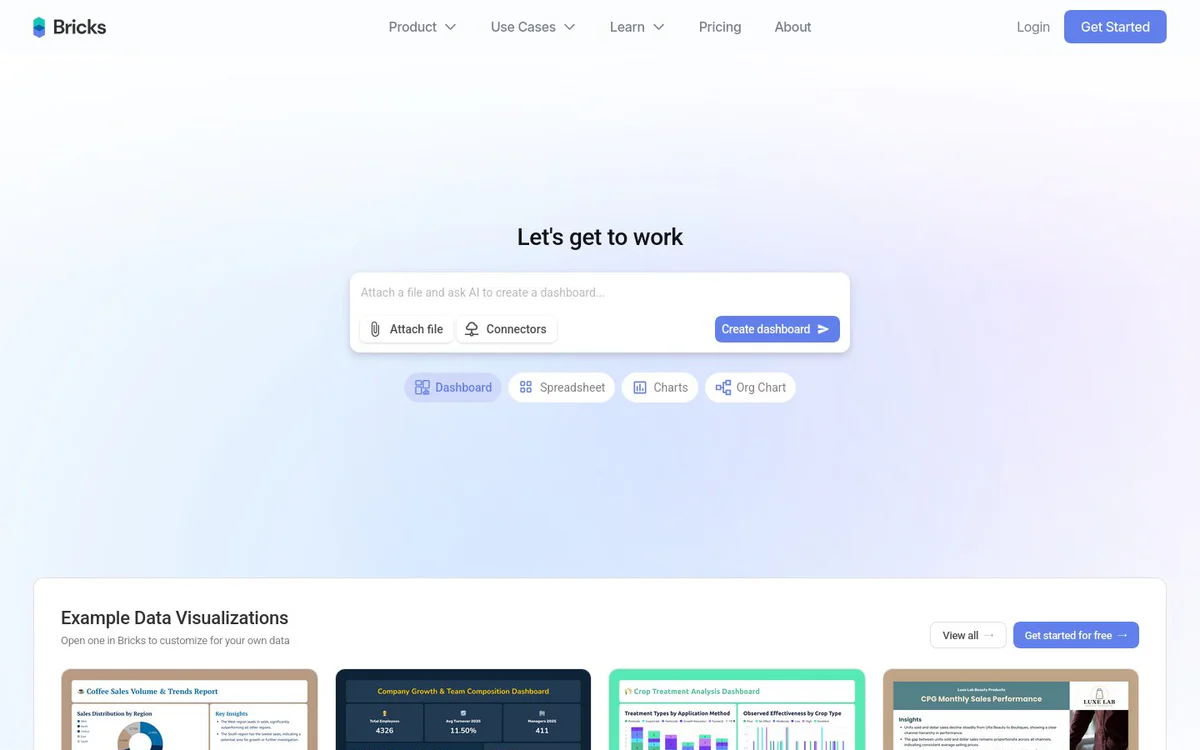
FreemiumAI data analyst that turns CSV and Excel files into interactive dashboards, reports, charts, presentations, and org charts in seconds.
Информация об инструменте
Что такое Bricks?
Bricks is an AI data analyst tool that enables users to upload spreadsheet data and instantly generate professional, customizable AI-powered dashboards, reports, visualizations, presentations, and related analytics outputs without manual chart building or complex BI tools.
Основные функции
AI Dashboards
Convert CSV and Excel files into interactive dashboards with charts, KPIs, and insights in seconds.
AI Reporting
Create reports from data using AI.
AI Charts & Graphs
Upload data to generate instant visualizations including heatmaps, treemaps, sankey, funnel, combo, scatter, donut, and other chart types.
AI Spreadsheet
Edit, transform, and analyze data with AI.
AI Presentations
Upload data to generate complete slide decks.
AI Org Chart
Create org charts from data instantly.
Full Control Over Every Dashboard Element
Drag, drop, and customize manually or use natural language to edit with AI.
One-Click Dashboard Refresh with New Data
Update data and instantly regenerate all charts while preserving layout.
Interactive Filtering for Deeper Insights
Click any data point to filter the entire dashboard and uncover hidden patterns.
Templates
Build once and reuse dashboard layouts with fresh data.
Professional Themes
Apply professional themes with zero design work.
Data Connectors and Uploads
Bring data from anywhere including CSV, Excel, and exports from sources such as Harvest, QBO, Toggl, QuickBooks, or NetSuite.
Варианты использования
- #1
Financial Services Dashboards
Turn financial data into dashboards fast, including budget, CFO, cash flow, and board reports.
- #2
Sales Pipeline Reports
Generate pipeline reports and opportunity insights for sales teams.
- #3
Marketing Campaign Metrics
Convert campaign metrics into reports instantly.
- #4
HR Workforce Analytics
Analyze workforce data instantly with AI.
- #5
Customer Support Insights
Turn ticket data into insights and customer service dashboards in seconds.
- #6
Operations Dashboards
Build operational dashboards without analysts.
- #7
Healthcare Patient Data Dashboards
Convert patient data to dashboards in seconds.
- #8
Retail Sales and Inventory
Create sales and inventory dashboards in seconds.
- #9
Construction Project Tracking
Track project costs and timelines instantly.
- #10
Education Student Insights
Turn student data into insights without IT help.
- #11
Startup and Small Business Reporting
Skip the data team to get professional reports and insights quickly.
- #12
Enterprise Reporting Scale
Scale reporting across all teams.
Тарифные планы
Offers get started for free and free AI dashboard generation options; documentation references billing; full paid plan details not specified on the provided pages.
Альтернативы







Часто задаваемые вопросы
What is Bricks?
How does Bricks create dashboards from spreadsheet data?
What types of visualizations can Bricks generate?
Is Bricks free to use?
What data sources does Bricks support?
Can I update a dashboard with new data without rebuilding it?
Who is Bricks designed for?
Does Bricks offer templates and themes?
Bricks Контакты и социальные сети
- Поддержка
- Веб-сайт:
- Twitter
- Instagram
- YouTube
- LinkedIn
- Discord
Отзывы
Поделитесь своим опытом использования этого инструмента...